Plotting: the standard figures#
Use propagation maps to locate spectral broadening, compression or beam motion, then inspect slices and statistics at the relevant positions. A logarithmic map reveals weak features, but its colour scale alone does not tell you their energy. Compare bands quantitatively with the processing tools.
The RDW lesson develops the usual
spectral, temporal and modal plots; the filament lesson
adds spatial intensity and fluence. This chapter describes the standard figures
and their units. Plotting functions accept an output object and return Matplotlib
figures without calling show; slice plots also accept an ax for a supplied panel.
Display units#
These are conventions of the figure. Everything solprop.processing returns is
SI (conventions.md §1); the conversion happens in
solprop.plotting.style, once.
quantity |
unit |
|---|---|
distance along the fibre |
centimetres |
time and pulse duration |
femtoseconds |
wavelength |
nanometres |
frequency |
petahertz |
angular frequency |
radians per femtosecond |
energy |
microjoules |
power |
auto-scaled, kilowatts to petawatts |
intensity |
terawatts per square centimetre |
spectral energy density on a map |
decibels below the peak |
A hollow planar run is per unit width in y, so its powers and energies carry a /m in
their labels (per_width()).
The propagation maps#
prop_2d() is the figure most runs are looked at
through: the spectral energy density in decibels beside the instantaneous power, both
against distance. A multimode run gets one figure per mode and a last one for the modal
sum; a single-mode run gets one figure. The spectral abscissa is frequency by default
and may be "wavelength" or "omega"; the colour scale runs down to db_min
(−60 dB). The decibel scale is shared, normalised by the
peak of the modal sum, so the modes are comparable, the sum’s map peaks at 0 dB and no
map goes above it.
The bandpass reaches the temporal panel only: a window drawn on the spectrum it is
displayed beside would be circular.
The spectral window spec_range is in the SI units of the abscissa, as everywhere in
solprop.processing: metres on "wavelength", hertz on "f" and rad/s on
"omega", so a frequency map can start at zero, which no wavelength range can say. The
same holds for spec_1d and spectrogram. Left out, it is a fixed wavelength range
converted to the abscissa; wavelength_to_axis() makes
that conversion for anyone who thinks in wavelength:
from solprop.plotting import prop_2d, wavelength_to_axis
from solprop.processing import example_output

output = example_output()
prop_2d(output, "f", spec_range=(0.0, 2e15))
prop_2d(output, "omega", spec_range=wavelength_to_axis("omega", (600e-9, 1100e-9)))
import matplotlib.pyplot as plt
from solprop.plotting import prop_2d
from solprop.processing import example_output

figure = prop_2d(example_output(), "wavelength", spec_range=(600e-9, 1100e-9),
                 time_range=(-100e-15, 100e-15))[0]
figure.set_size_inches(9.5, 3.4)
figure.tight_layout()
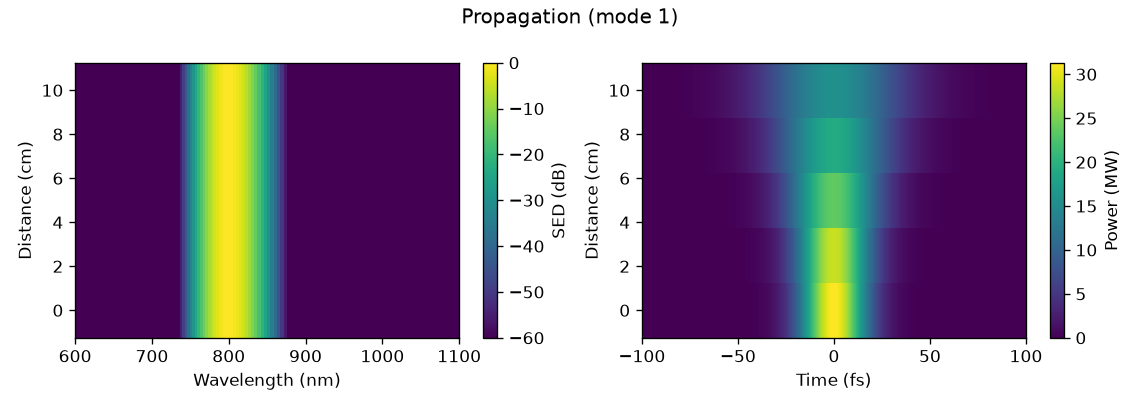
The example run: a 30 fs Gaussian broadened by pure group-velocity dispersion. The spectrum does not move, which is what pure dispersion means, and the pulse doubles its duration.#
The slices#
time_1d() and
spec_1d() draw one or more positions along the
fibre: a colour per position, a dash pattern per mode (the patterns repeat when there
are more modes than patterns), and the width at half maximum
appended to each temporal legend entry. time_1d draws the power, the real field or its
square; spec_1d draws the density on any of the three abscissae, logarithmic by default
over six decades.
import matplotlib.pyplot as plt
from solprop.plotting import spec_1d, time_1d
from solprop.processing import example_output

output = example_output()
figure, (left, right) = plt.subplots(1, 2, figsize=(9.5, 3.4))
time_1d(output, [0.0, 0.1], time_range=(-120e-15, 120e-15), ax=left)
spec_1d(output, [0.0, 0.1], spec_range=(600e-9, 1100e-9), ax=right)
figure.tight_layout()
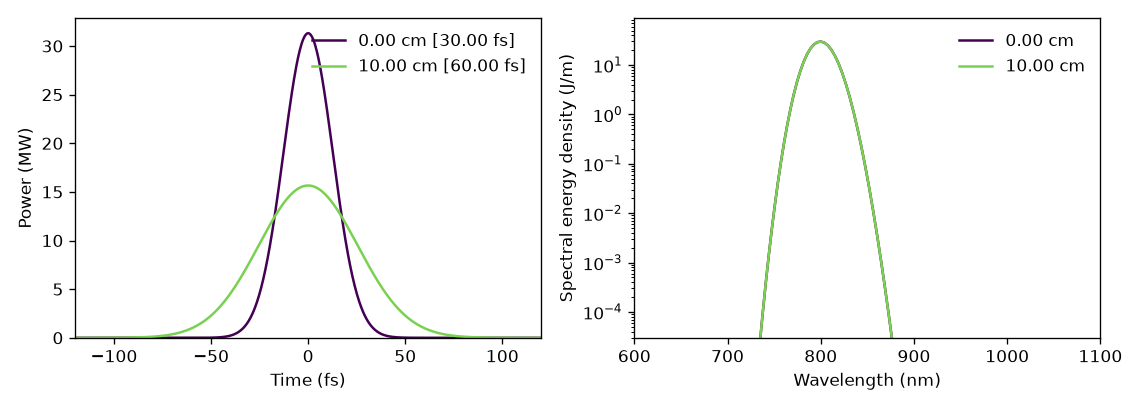
Time and spectral slices at the two ends of the example run. The spectrum is unchanged and the pulse is twice as long, as pure dispersion requires.#
time_1d() also takes transfer=, a linear
optical element of solprop.optics, and transform_limit=, and draws the pulse
after a compressor or at its limit (compression);
spectrogram() takes transfer=.
plot_energy() follows the energy along the fibre in
microjoules, with a linked right-hand axis in per cent of the total energy of every mode at
the first plane, which is what a conversion efficiency means. Its limits are computed
from the left axis’s, so the two axes always agree.
The statistics panels#
plot_stats() draws every statistic a run recorded, in two
figures: what the pulse did, and what the waveguide and the gas were doing while it did
it. Only the groups that have something in them are made, and a run with no statistics at
all gives an empty list and no error.
A panel gets a logarithmic ordinate when its values are everywhere positive and span more than a decade. Per-mode statistics are drawn as one line per mode, named from the run’s own metadata.
from solprop.plotting import plot_stats
from solprop.processing import example_output

figure = plot_stats(example_output())[0]
figure.set_size_inches(8.0, 6.0)
figure.tight_layout()
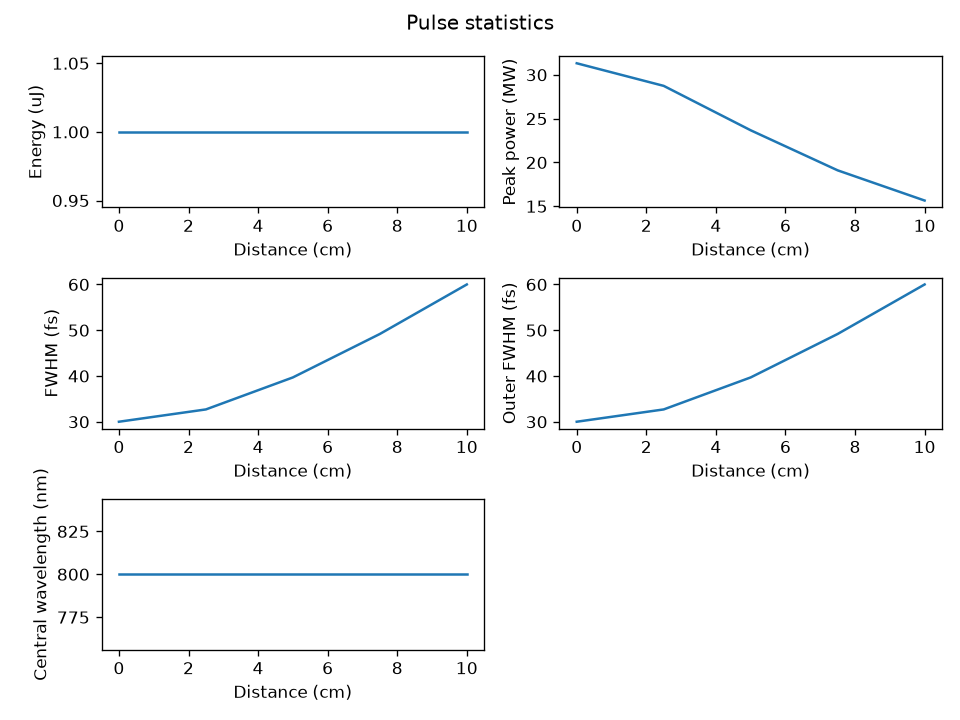
The pulse statistics of the example run. The energy is conserved, the peak power halves and the duration doubles, which is the whole of what pure dispersion does.#
Spectrograms#
spectrogram() gates the real field with a Gaussian
and transforms at evenly spaced positions, through
scipy.signal.ShortTimeFFT. The trade is the usual one: a gate of duration
\(\tau\) resolves frequencies no better than \(1/\tau\), so a short gate shows when and a
long gate shows what. The gate below is at the geometric mean of the transform-limited
duration and the chirped one, which is where a linear chirp is most legible. By default
the gate is a twentieth of the time range wide (gate_fwhm) and is placed at 256
positions across it (positions); log=True draws decibels below the peak. A spectrogram
is of one field, so a multimode run must name the mode it means, and is refused if it
does not. The map itself, without the figure, is
get_spectrogram(): the gate positions, the spectral
axis and the values, per unit of that axis, with the same gate and a bandpass= window.
import numpy as np
from solprop.grid import EnvelopeGrid
from solprop.output import MemoryOutput
from solprop.output.schema import GridRecord, RunMetadata, SavedPlane, StepperRecord
from solprop.plotting import spectrogram
from solprop.pulses import GaussianPulse

grid = EnvelopeGrid.from_limits(1.0, 800e-9, (400e-9, 2e-6), 4e-12)
tau0 = 30e-15 / (2 * np.sqrt(np.log(2)))
pulse = GaussianPulse(wavelength=800e-9, fwhm=30e-15, energy=1e-6).build(grid)
chirped = pulse * np.exp(-0.5j * 45 * tau0**2 * (grid.omega - grid.omega0) ** 2)

output = MemoryOutput()
output.open(
    RunMetadata(
        grid=GridRecord.from_grid(grid),
        modes=(),
        simulation_kind="mode_averaged",
        configuration={},
        stepper=StepperRecord(tableau="DOPRI5", controller={}),
    )
)
output.save(SavedPlane(z=0.0, field=chirped))

figure = spectrogram(
    output,
    time_range=(-1.2e-12, 1.2e-12),
    gate_fwhm=200e-15,
    spec_range=(700e-9, 950e-9),
)
figure.set_size_inches(6.4, 3.6)
figure.tight_layout()
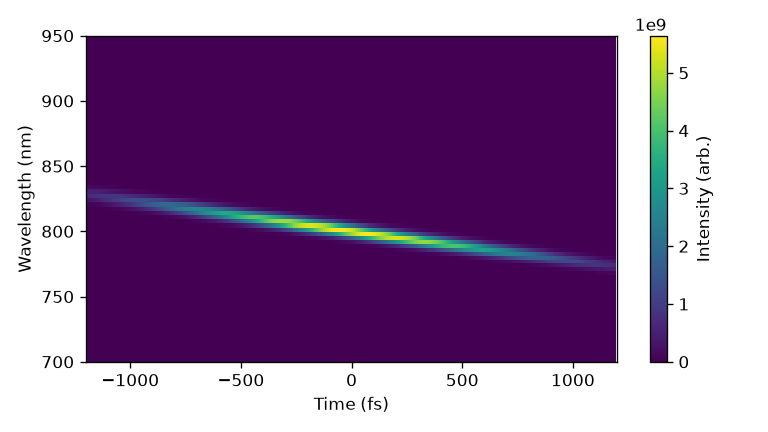
A 30 fs pulse carrying 45 times its own duration of group-delay dispersion. Long wavelengths arrive first and short ones last, which is what normal dispersion does and what the optics sign convention says it should look like.#
The style helpers#
helper |
what it does |
|---|---|
A colour map whose lowest colour is white, so that an empty map looks empty. |
|
Evenly spaced colours for a family of lines. |
|
A near-square grid of exactly the axes asked for; surplus ones are removed. |
|
The factor and the label that put a power between one and a thousand. |
|
The factor and the axis label of a spectral abscissa. |
|
A wavelength range as SI limits on any of the three abscissae. |
|
A panel label in a corner, in axis coordinates. |
|
Two arrows and a label marking a trace’s width at half maximum. |
|
|
|
The |
Mode names come from the structured metadata: a mode records the class it is and the arguments it was built from, so the label is read rather than parsed out of a printed description, and a change to how a mode prints cannot break it.
Cross-section drawings#
solprop.plotting.geometry draws the cross-section of a guide or a free-space grid:
its outline, not its fields. A capillary is its gas-filled bore in a wall; an
antiresonant fibre its tubes, to scale, inside a jacket; a step-index fibre or a
graded-index provider its core in a cladding; a rectangular or planar guide its bore
between walls or plates; and a radial, Cartesian, line or planar grid its medium with
the absorbing collar its collar_fraction adds outside it. The cross-section figures of
the spatial decompositions draw their outlines
from it, so the manual and the library show one geometry.
None of the hollow-guide models carries a wall thickness: the wall enters only through
the effective index. It is drawn
WALL_FRACTION of the guide’s size thick, and so
is an antiresonant fibre’s jacket. A direction the geometry leaves unbounded, a
fibre’s cladding or the y of a planar guide or a line grid, is drawn to the extent
you give, in metres. Everything else is to scale, at the position z along a guide
whose radius or width varies.
import matplotlib.pyplot as plt

from solprop.modes import TubeLattice, VincettiMode
from solprop.plotting.geometry import draw

lattice = TubeLattice(wall_thickness=180e-9, tube_radius=9e-6, n_tubes=6)
fibre = VincettiMode(15e-6, cladding=1.45, lattice=lattice)
figure, ax = plt.subplots(figsize=(4, 4))
draw(ax, fibre)  # axes in micrometres, equal aspect
plt.close(figure)
name |
what it does |
|---|---|
The cross-section as shapes in metres, back to front: each a
|
|
Those shapes in a Matplotlib axes, in micrometres. |
|
A small square figure of a route’s representative guide or grid, with no axes,
for a front end’s route picker; the pairs it draws are listed in
|
|
The colours: a fill and an edge per region, a background and the dashed
boundary, each a |
The colours are explicit rather than styled by a stylesheet, so a drawing looks the
same in Matplotlib, saved as SVG, and in a Qt application. A thumbnail is a bare
matplotlib.figure.Figure, made without pyplot: it needs no closing, saves to PNG or
SVG with savefig at size pixels square, and shows in Qt through
matplotlib.backends.backend_qtagg.FigureCanvasQTAgg.
import io

from solprop.plotting.geometry import DARK, thumbnail

icon = thumbnail("capillary", "mode_averaged", 96, palette=DARK)
buffer = io.BytesIO()
icon.savefig(buffer, format="png")  # 96 x 96 pixels, for a picker's icon
The geometry outlines were proposed and carried out by SEP 41.